How the EPA Tests Fuel Economy
Every new vehicle sold in the United States goes through a federally mandated fuel economy testing process administered by the Environmental Protection Agency. Contrary to a common misconception, this testing doesn't happen on a highway or a test track - it happens in a laboratory.
Technicians place the vehicle on a device called a chassis dynamometer, which is essentially a set of rollers the driven wheels spin against. The dynamometer is calibrated to simulate the resistance a vehicle would encounter on the road, accounting for factors like wind drag and rolling friction. The engine runs, the wheels turn, but the car stays stationary.
The vehicle is then driven through a set of standardized drive cycles - pre-programmed speed and acceleration patterns that represent typical driving scenarios. The EPA currently uses five drive cycles in total:
- City cycle (FTP-75): Low speeds, frequent stops, and some idling - meant to simulate urban driving.
- Highway cycle (HWFET): Higher speeds with steadier acceleration, representing freeway travel.
- High-speed cycle (US06): Accounts for aggressive acceleration and speeds above 60 mph.
- Air conditioning cycle (SC03): Tests the impact of running the climate control system.
- Cold temperature cycle: Replicates the FTP-75 at about 20°F to capture cold-start fuel penalties.
Raw fuel consumption data from these tests is collected, then the EPA applies correction factors that reduce the lab numbers - typically by 10-25% - to arrive at the MPG figures printed on the window sticker. This adjustment acknowledges that lab conditions are more controlled than real-world driving.
10-25%
EPA adjustment applied to raw lab results
The EPA reduces raw dynamometer test results by this range before publishing official MPG figures, acknowledging that lab conditions are more controlled than everyday driving.
~1-2%
MPG reduction per 100 lbs of added weight
General automotive engineering principles indicate that every 100 pounds of additional vehicle load reduces fuel efficiency by approximately this amount, though exact results vary by vehicle.
5
Drive cycles used in EPA testing
The EPA uses five standardized drive cycles - city, highway, high-speed, air conditioning, and cold temperature - to capture a range of real-world driving conditions.
Why Your Real-World MPG Often Falls Short
Even with the EPA's adjustment factors applied, there are many reasons a driver might consistently see lower MPG than the sticker suggests - and none of them mean the vehicle is defective.
Driving Behavior
Hard acceleration, late braking, and high sustained speeds are among the biggest fuel economy killers. The EPA's drive cycles use moderate, consistent patterns. If your daily commute involves a lot of merging at speed or stop-and-go expressway traffic, your consumption will climb.
Climate and Temperature
Cold weather reduces fuel economy in every vehicle. Engines take longer to reach optimal operating temperature, battery-assisted systems (in hybrids) lose efficiency, and road traction aids may engage more frequently. Air conditioning adds meaningful load in summer heat.
Cargo and Passengers
A heavier vehicle requires more energy to accelerate. Every additional 100 pounds reduces fuel economy by roughly 1-2%, according to general engineering principles - though exact figures vary by vehicle type.
Tire Pressure and Vehicle Condition
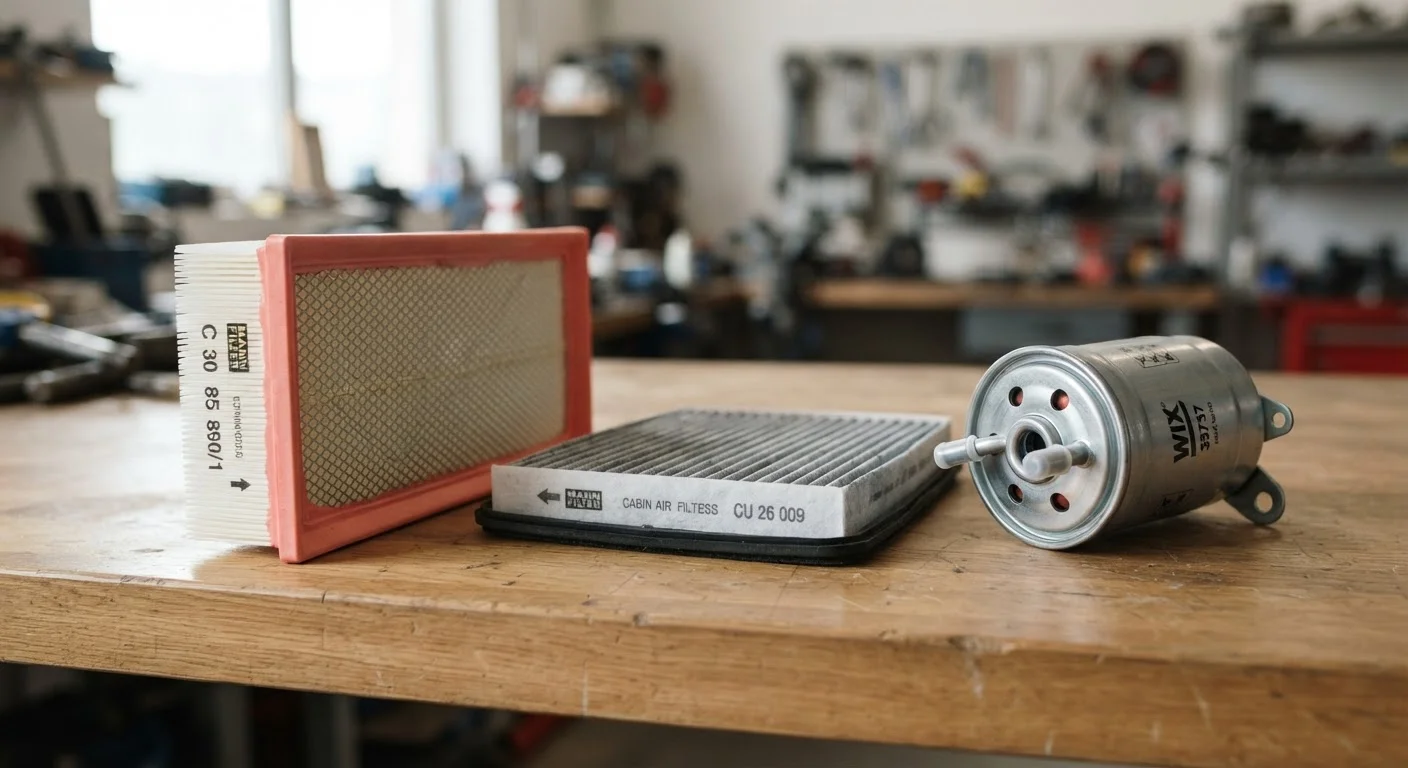
Under-inflated tires increase rolling resistance, directly reducing MPG. Proper tire inflation is one of the simplest and most effective steps to preserve fuel efficiency. Similarly, a clogged air filter, degraded spark plugs, or the wrong grade of motor oil can all suppress real-world performance. Your owner's manual specifies the service intervals and fluid grades engineered to keep your vehicle running at its rated efficiency.
Close the Gap With Simple Habits
Smooth, gradual acceleration and early braking consistently improve real-world fuel economy. Combining short trips into one outing also helps, since engines burn more fuel during cold starts. Even small adjustments to driving style can meaningfully reduce the gap between rated and actual MPG over time.
Understanding the Numbers on the Window Sticker
The Monroney label - the official window sticker on every new vehicle - displays three primary MPG figures: city, highway, and combined. The combined figure is a weighted average: roughly 55% city driving and 45% highway, reflecting typical American driving patterns as determined by federal transportation research.
For plug-in hybrids, you'll also see an electric-only range estimate and a charge-depleted MPG for when the battery is exhausted. Electric vehicles display MPGe (miles per gallon equivalent) - a conversion that expresses kilowatt-hour consumption in gasoline terms so buyers can compare across powertrains.
The sticker also includes an annual fuel cost estimate based on a set price per gallon and assumed annual mileage. This figure is useful for rough comparisons, but your actual cost will depend on local fuel prices and how many miles you drive.
“The window sticker estimate is a useful benchmark for comparison shopping, but it was never meant to be a guarantee of what any individual driver will see. Your habits, your climate, and your roads all write the final number.”
— Cars & Driving Editorial Team, Automotive consumer education writers
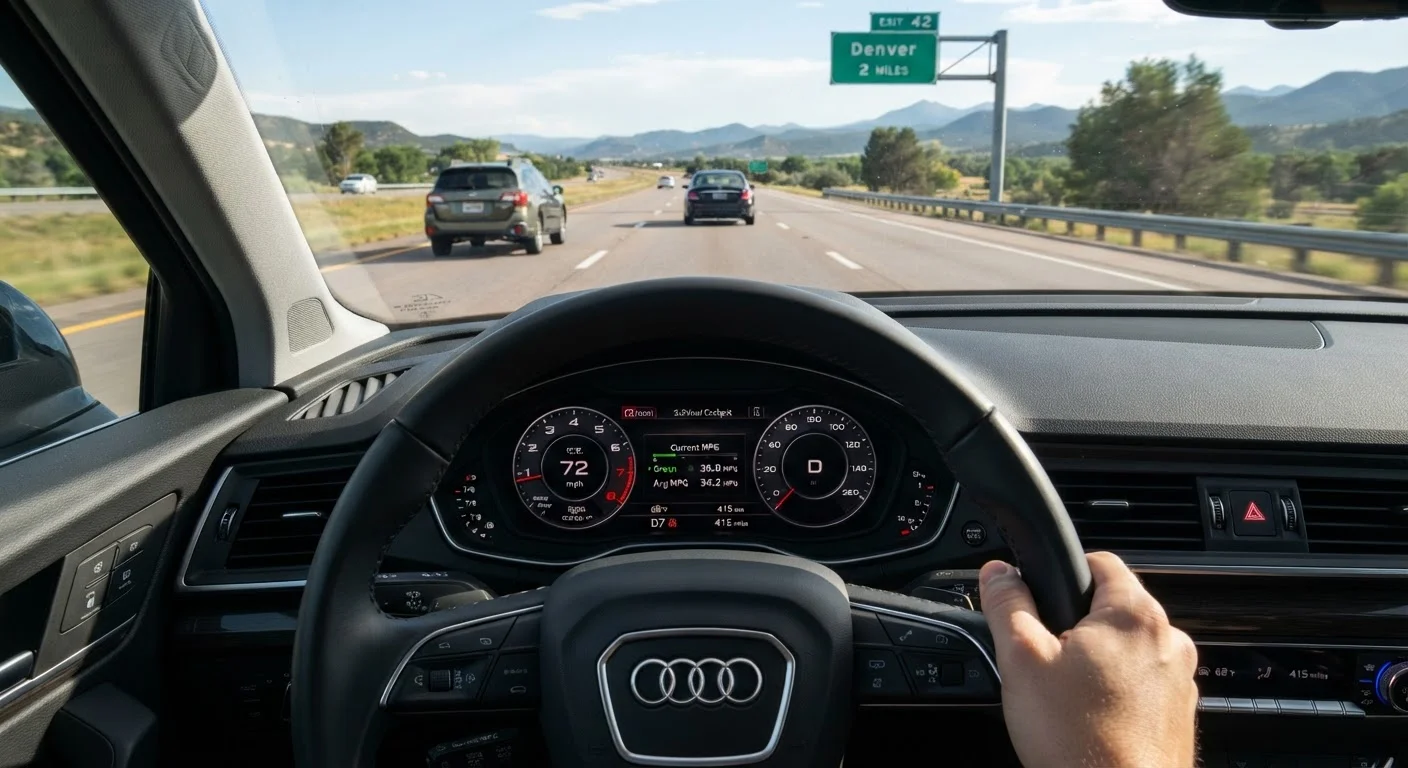
The most accurate way to track your own fuel economy is to record your odometer reading at every fill-up and divide miles traveled by gallons added. Doing this over several tanks gives a reliable average that reflects your actual driving conditions - and makes it far easier to spot efficiency changes that might signal a maintenance issue.